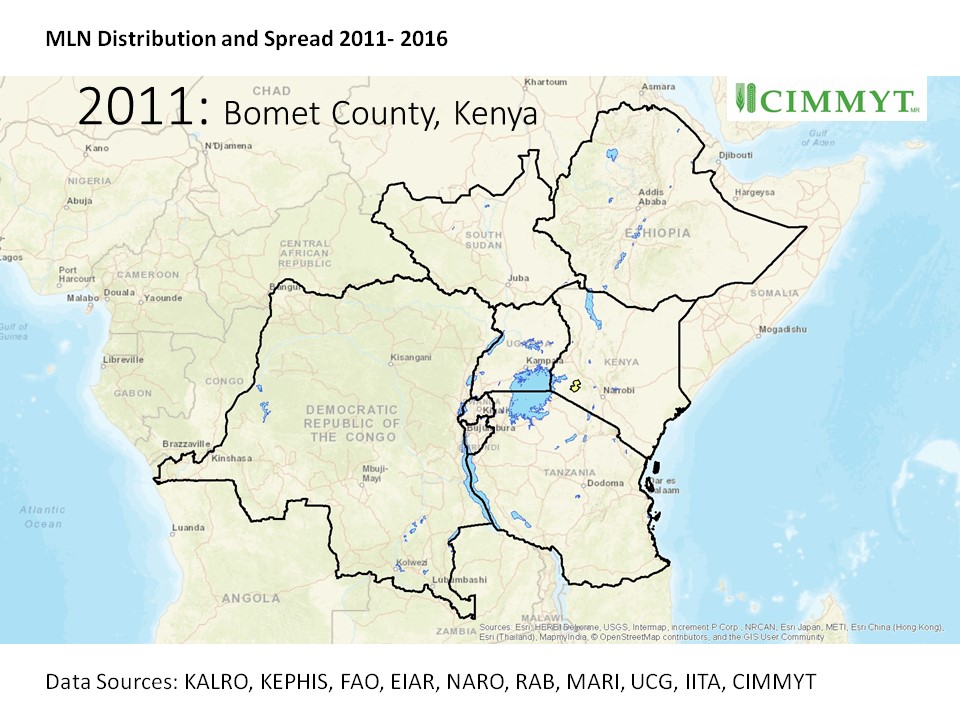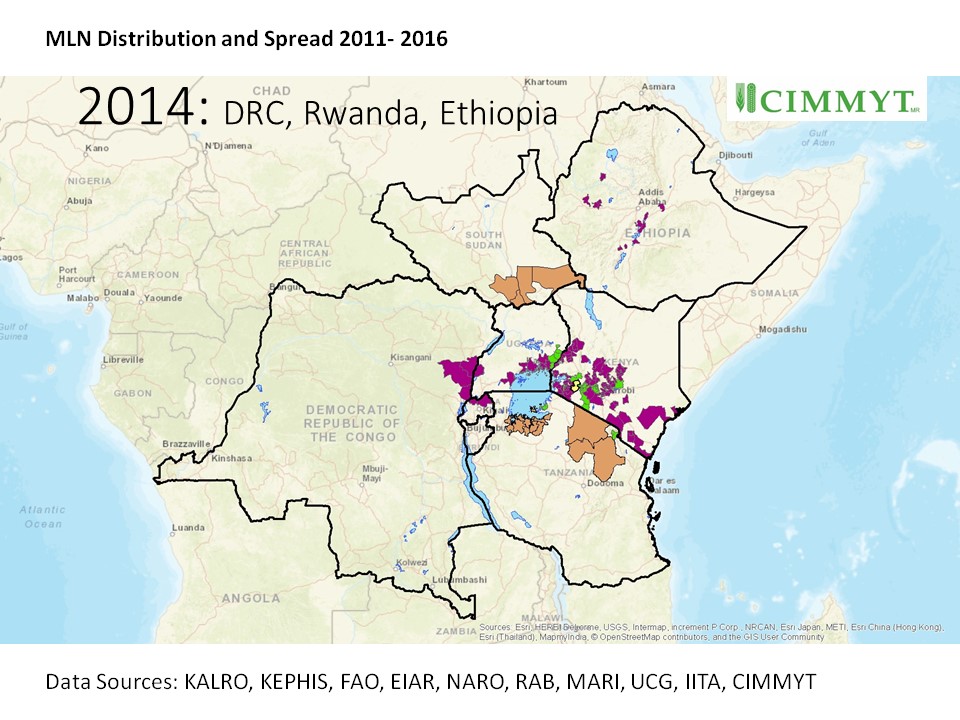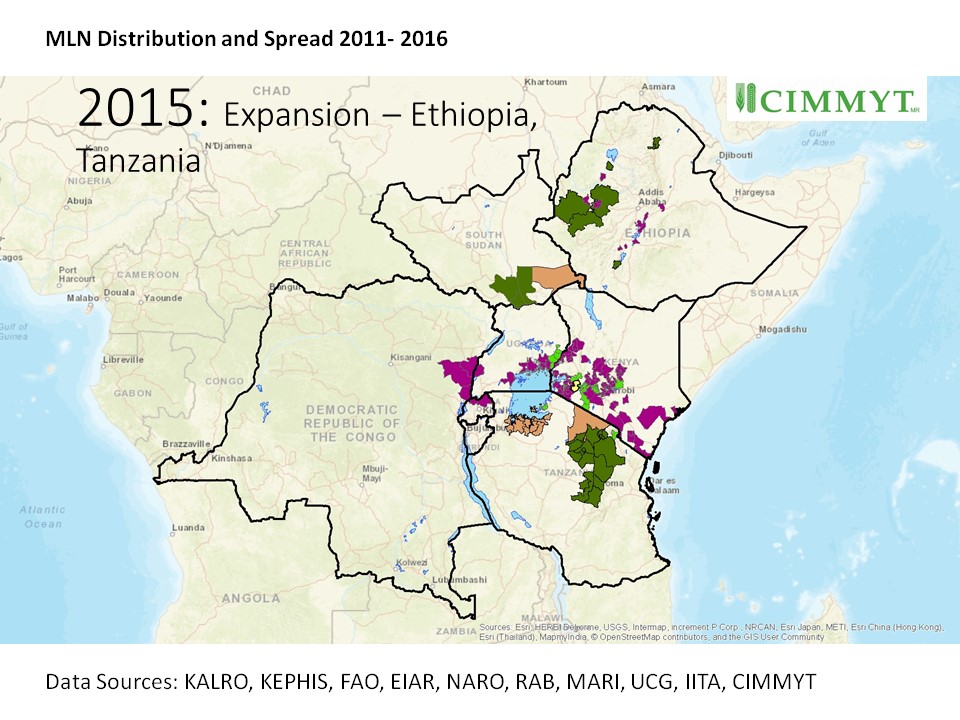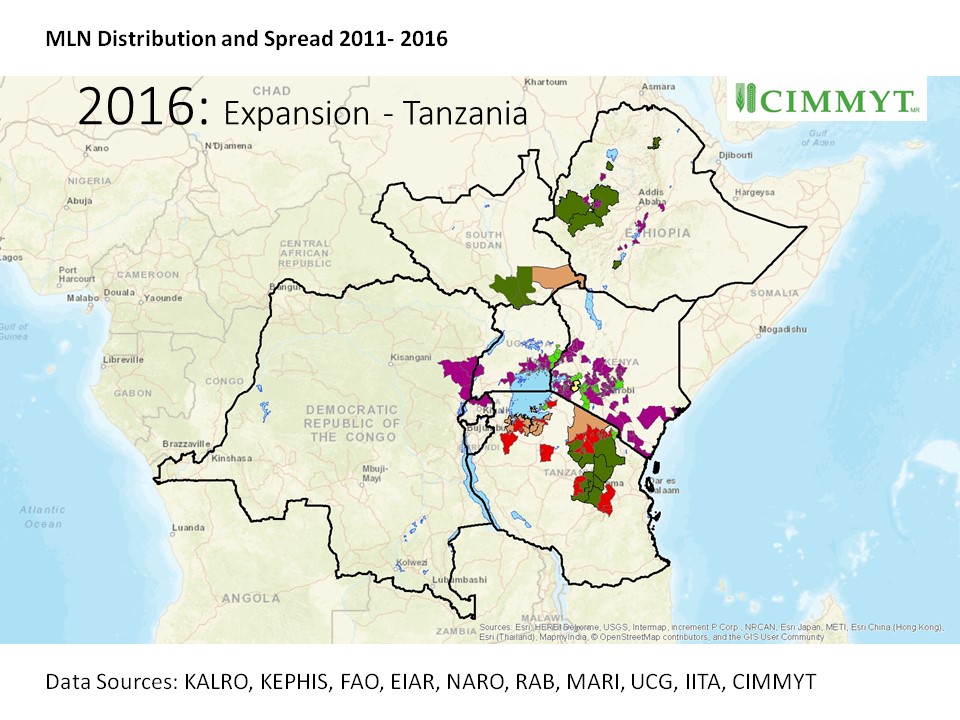
MLN Distribution and Spread in Africa
The following graphic indicates the approximate reported distribution and spread of MLN in Africa from 2011-2016. It must be noted; locations are approximate – solely districts or zones in which MLN has been reported. Plus, MLN may have been present in different regions before it was officially reported. The graphic was created using data from KALRO, KEPHIS, FAO, EIAR, NARO, RAB, MARI, IITA & CIMMYT.