MLN TOOLS: Maps and Charts
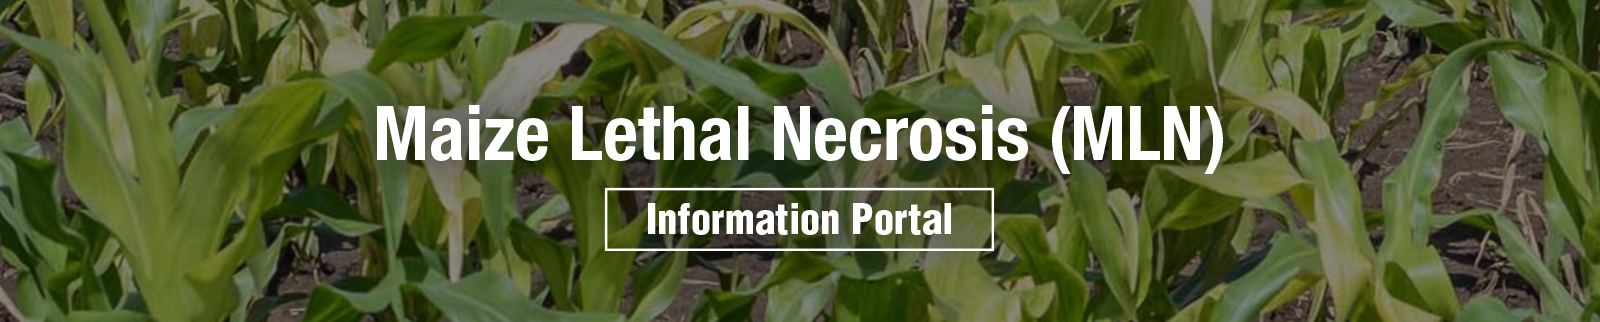
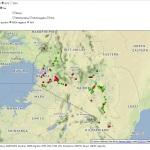
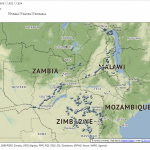
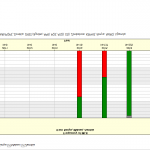
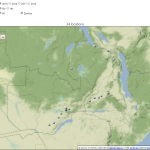
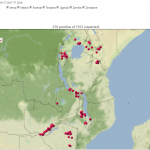
The MLN Tools: Interactive maps and charts developed by Aarhus University, Denmark, that display MLN field survey data. The four charts shown below show survey locations, results of surveys, frequency map showing frequency of MLN observed from the survey data and a frequency chart that displays number of infected and non infected fields over time.
 |
 |
|||
| Survey Results | Field Survey Location Map | |||
 |
 |
|||
| Survey Frequency Map | Survey Frequency Chart | |||
 |
 |
|||
| Seed Survey Location Map | Survey Pests | |||